
Running a Virtual Private Server (VPS) is like owning a car you need regular check-ups to keep it running smoothly. But unlike a car, your VPS works 24/7, and problems can escalate quickly if left unnoticed.
The Problem: Manual Monitoring Doesn’t Scale
If you’re managing a VPS on Hetzner, AWS, DigitalOean, or any cloud provider, you’ve probably found yourself SSH-ing into your server just to run basic health checks:
bash
free -h          # Check memory usage
top              # Monitor CPU
df -h            # Check disk space
uptime           # System load average
This works fine when you remember to do it. But here’s the reality:
- You forget to check regularly – Life gets busy, and manual checks fall off your radar
- Problems go unnoticed – By the time you notice high CPU or memory usage, your application might already be down
- It’s time-consuming – Logging in daily just to run commands is inefficient
- No historical data – You can’t track trends or spot gradual performance degradation
The Solution: Automated Daily Health Reports
Instead of manually checking your server every day, imagine receiving a comprehensive health report directly in your inbox every morning. No SSH required. No commands to remember.
What Gets Monitored?
A good VPS health monitoring system tracks the metrics that matter:
- CPU Usage – Is your processor being overworked?
- Memory Consumption – Are you running out of RAM?
- System Load – How many processes are waiting for resources?
- Active Users – Who’s logged into your system?
- Timestamp – When was this snapshot taken?
Why Email Reports?
Email is the perfect delivery method for daily health reports:
- Universal Access – Check your server health from anywhere, on any device
- Historical Archive – Your inbox becomes a searchable history of server performance
- No Extra Dashboards – No need to log into yet another monitoring platform
- Visual Insights – Charts and graphs make trends immediately obvious
- Actionable Alerts – Spot issues before they become emergencies
Real-World Benefits
Early Problem Detection
Instead of discovering your server crashed at 3 AM through angry customer emails, you’ll see warning signs days in advance. Memory creeping up? CPU consistently high? Your morning report will show the trend.
Peace of Mind
Knowing your server is healthy lets you focus on building your product, not babysitting infrastructure. One glance at your daily report tells you everything is running smoothly.
Better Capacity Planning
Historical email reports help you understand usage patterns. Planning to launch a new feature? Check last month’s reports to see if you need to upgrade your VPS plan first.
Professional Infrastructure Management
Whether you’re a solo developer or managing infrastructure for a team, automated monitoring demonstrates professional operations. It’s the difference between reactive firefighting and proactive maintenance.
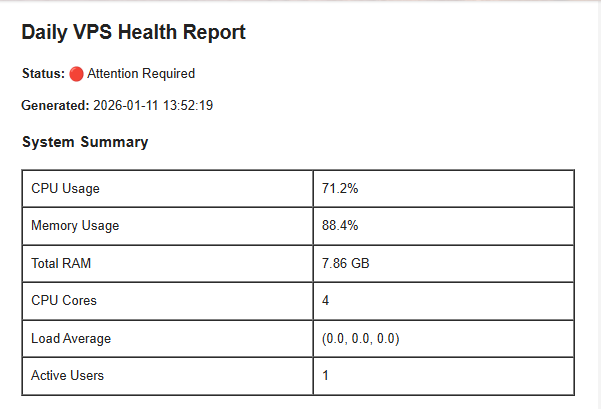
What a Good Health Report Looks Like
An effective daily health report should be:
- Visual – Charts and graphs for quick understanding
- Comprehensive – All critical metrics in one place
- Professional – Clean formatting that’s easy to scan
- Actionable – Clear indicators of healthy vs. concerning states
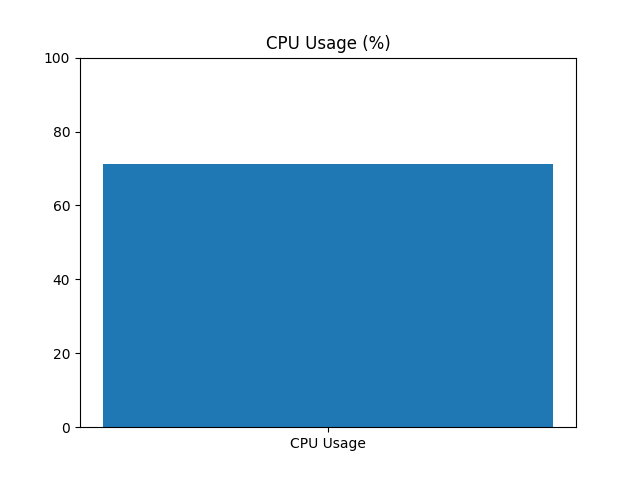
Example: Daily CPU usage visualization helps spot unusual spikes
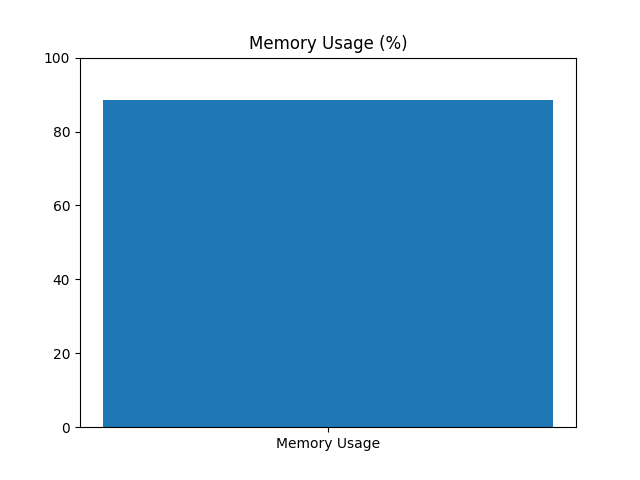
Example: Memory trends over the past 24 hours
Automation: Set It and Forget It
The beauty of automated monitoring is that it runs whether you remember it or not. Using CRON jobs on Linux, your monitoring script executes daily at your chosen time, collects metrics, generates charts, and sends the report all without manual intervention.
This means:
- Reports arrive even when you’re on vacation
- No dependencies on you remembering to check
- Consistent monitoring regardless of how busy you are
- Server health data continues accumulating in your inbox
Who Needs This?
Automated VPS health monitoring is valuable for:
- Solo Developers – Managing personal projects and side hustles
- Small Teams – Coordinating infrastructure without dedicated DevOps
- Agencies – Monitoring client servers and catching issues proactively
- Startups – Professional infrastructure management on a budget
- Anyone Running Production Services – If downtime costs you money or reputation, you need monitoring
Getting Started
Setting up automated VPS health monitoring doesn’t require complex infrastructure or expensive tools. With Python and a few libraries, you can build a production-ready monitoring system that:
- Collects real-time metrics using
psutil - Generates email-safe PNG charts with
matplotlib - Sends professional HTML reports via SMTP
- Runs automatically via CRON scheduling
The complete source code, setup instructions, and detailed implementation guide are available in our GitHub repository.
Conclusion
Your VPS is the foundation of your online presence. Whether you’re running a blog, an API, an e-commerce site, or any web application, server health directly impacts user experience.
Manual monitoring is reactive and unreliable. Automated daily health reports are proactive and consistent. They give you visibility, peace of mind, and the early warning system you need to keep services running smoothly.
Stop SSH-ing into your server to run free -h every day. Let automation handle the monitoring while you focus on what matters building great products.
Ready to automate your VPS monitoring? Check out our complete implementation guide with source code, setup instructions, and email templates on GitHub.
Have questions or suggestions? Drop a comment below or reach out on Twitter/LinkedIn.


Leave a Comment